API
Pre-build pipelines
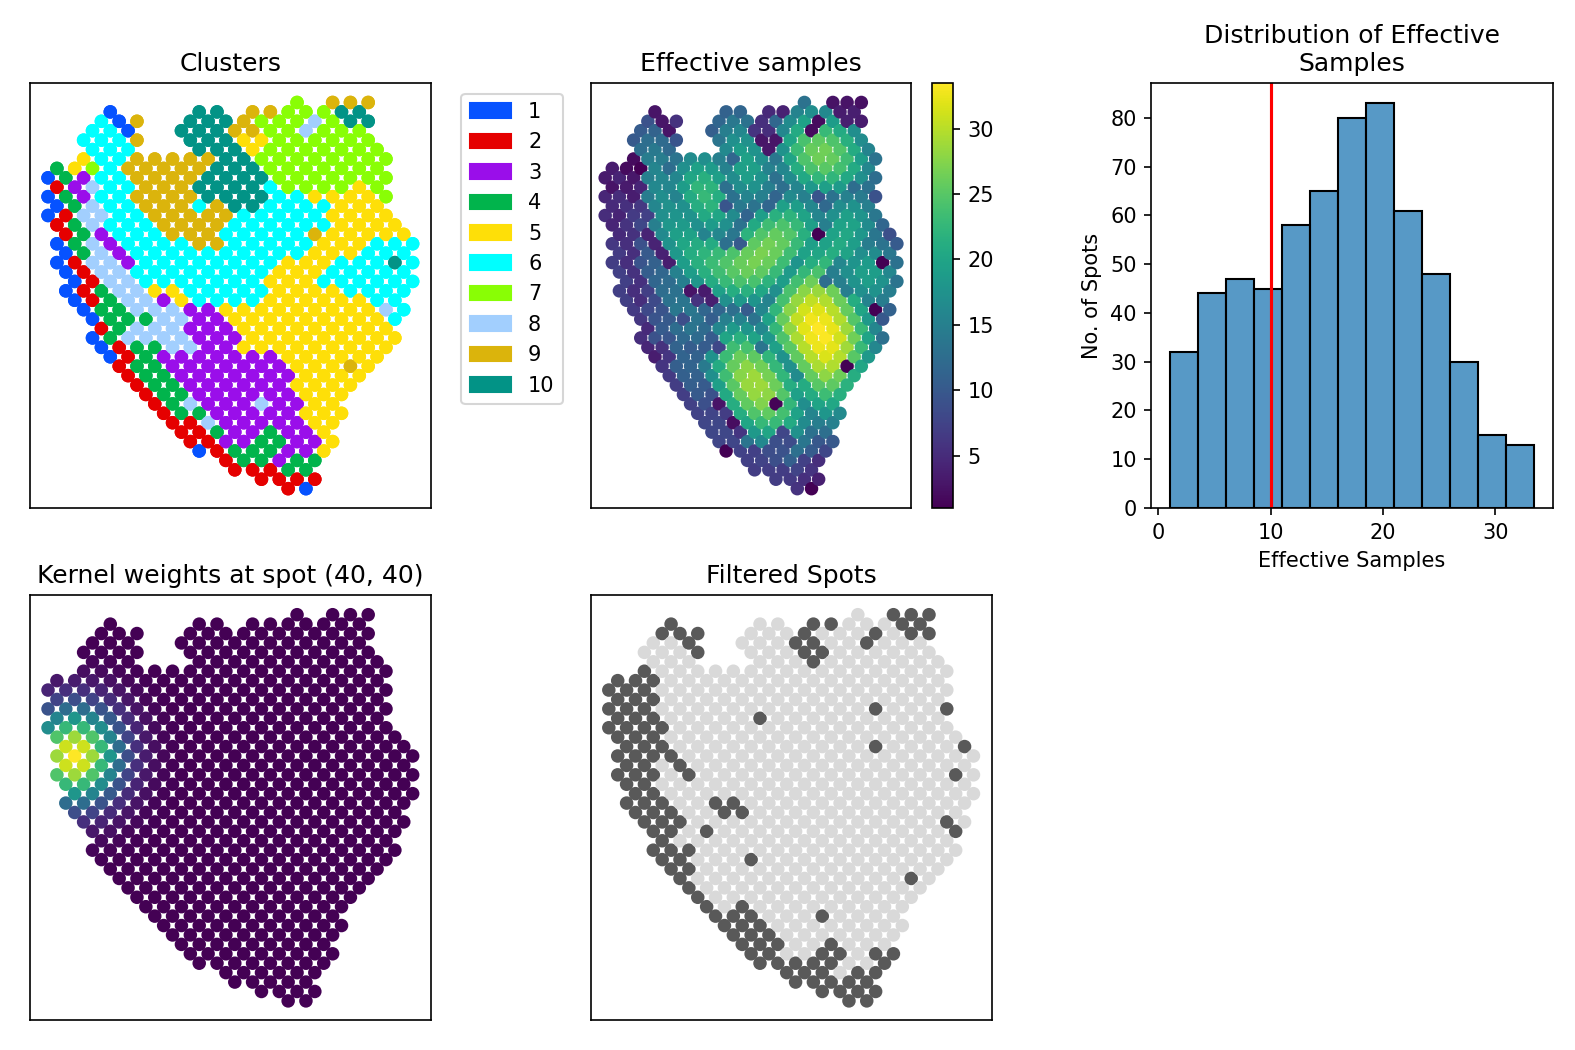
The following wrapper function creates plots to diagnose the spatial kernel used in SpatialCorr’s statistical tests.
- spatialcorr.kernel_diagnostics(adata, cond_key, bandwidth, contrib_thresh=10, row_key='row', col_key='col', dsize=12, fpath=None, fformat='pdf', dpi=150)
Create plot to visualize the spatial kernel used for SpatialCorr’s statistical analyses.
This function will plot the following analyses: Top left: The annotated regions/clusters Bottom left: The kernel weights at a randomly chosen spot (i.e., a row of the kernel matrix) Top middle: The effective number of samples used to estimate correlation at each spot (i.e., the sum of each row of the kernel matrix) Bottom middle: The spots that would be filtered when applying an effective spots threshold of contrib_thresh (shown in grey) Top right: A distribution of the effective number of samples used to estimate correlation at each spot across the entire slide. The red verticle line shows the effective samples threshold set by contrib_thresh
- Parameters
- adataAnnData
spatial gene expression dataset with spatial coordinates stored in adata.obs
- cond_keystring
the name of the column in adata.obs storing the cluster assignments
- bandwidthint
the kernel bandwidth used by the test
- contrib_threshint, optional (default: 10)
threshold for the total weight of all samples contributing to the correlation estimate at each spot. Spots with total weight less than this value will be filtered prior to running the test
- row_keystring, optional (default: ‘row’)
the name of the column in adata.obs storing the row coordinates of each spot
- col_keystring, optional (default: ‘col’)
the name of the column in adata.obs storing the column coordinates of each spot
- dsize: int, optional (default: 12)
the size of the dots in the scatterplot
- fpath: string, optional (default: None)
Path to write figure image.
- fformat: string, {‘pdf’, ‘png’} (default: ‘pdf’)
Format of the output figure file.
- dpi: int (default: 150)
Resolution of output image.
- Returns
- None
It outputs the following multi-panel figure:
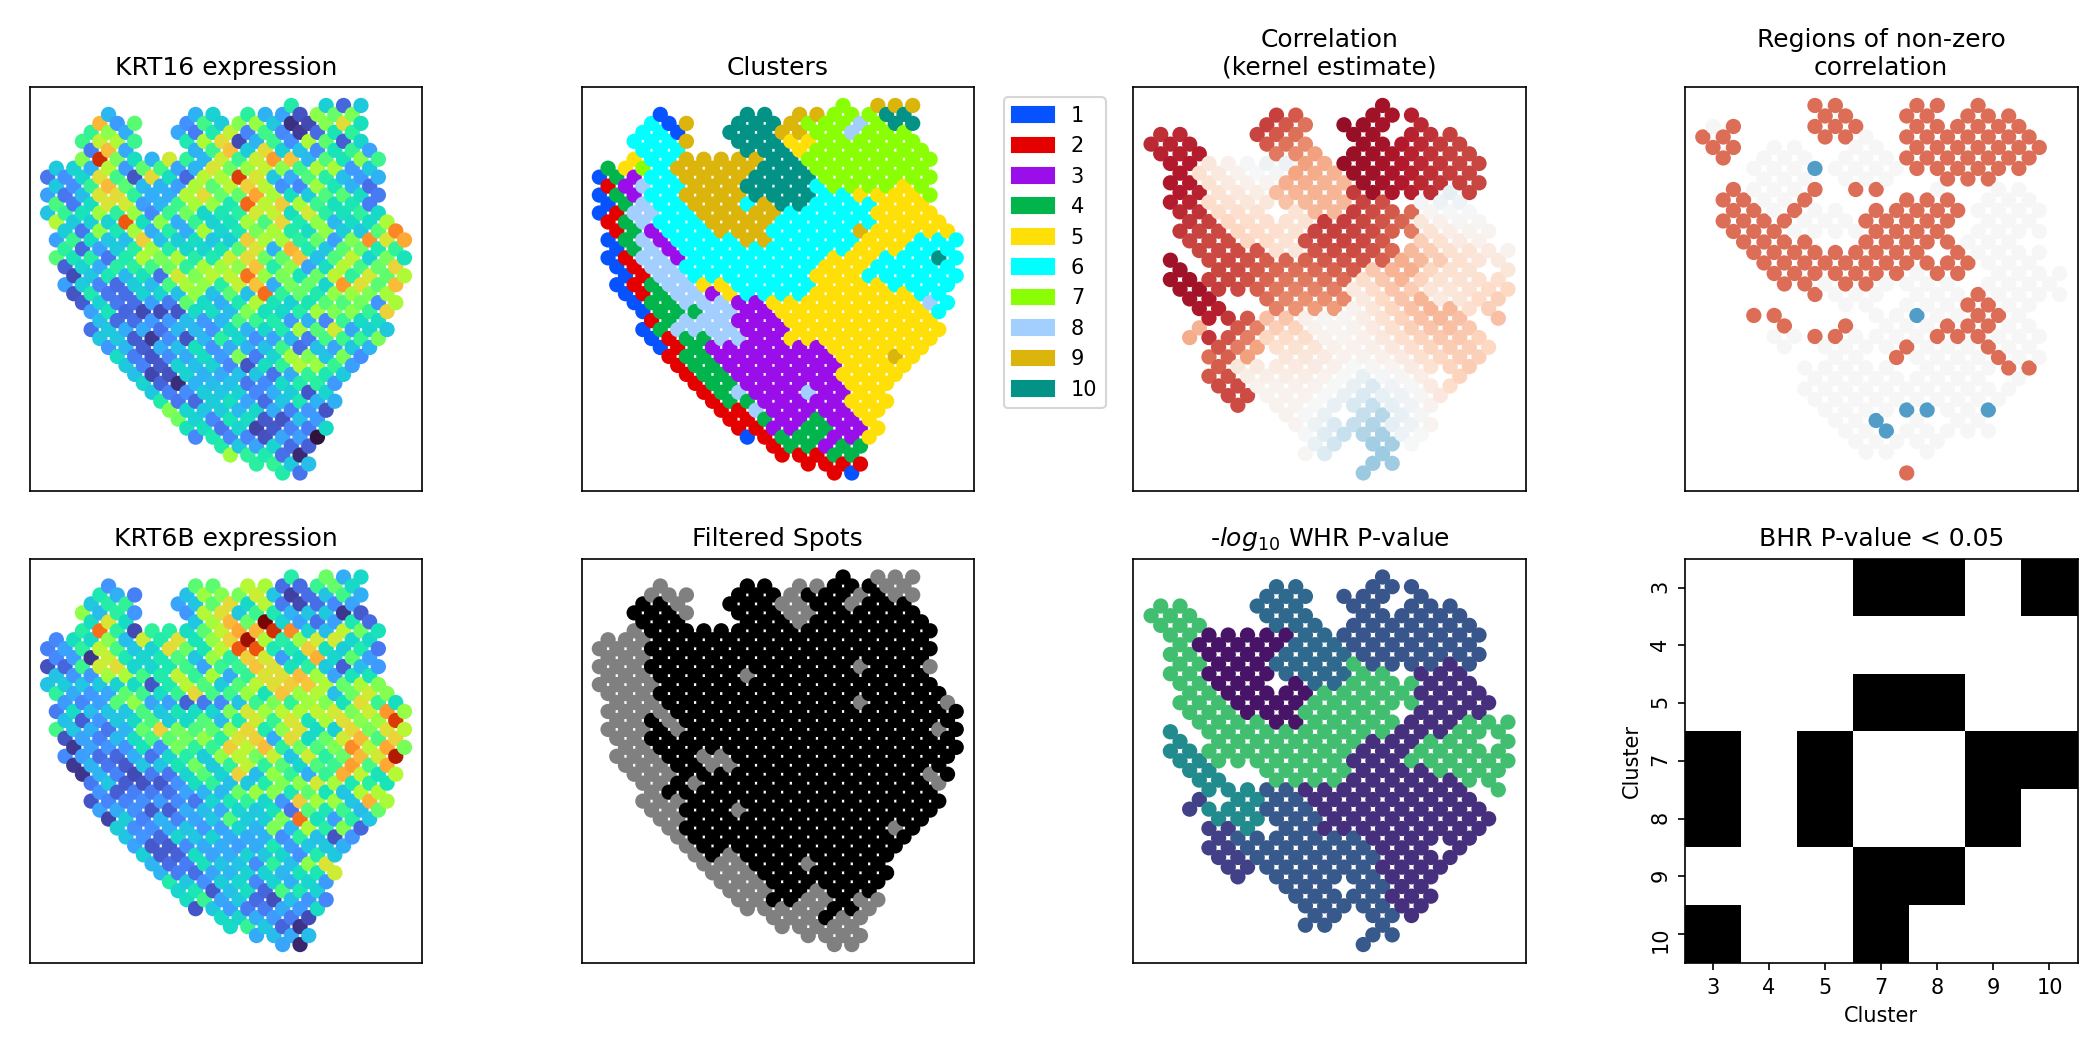
The following wrapper function implements a full analysis pipeline for investigating spatially varying correlation between a pair of genes.
- spatialcorr.analysis_pipeline_pair(gene_1, gene_2, adata, bandwidth, cond_key, row_key='row', col_key='col', reject_thresh=0.05, dsize=12, max_perms=500, n_procs=5, contrib_thresh=10, verbose=1, fig_path=None, fig_format='pdf', dpi=150, only_stats=False)
Run a SpatialCorr analysis pipeline on a pair of genes.
This function will run the following analyses: 1. Compute spotwise kernel estimates of correlation 2. Compute confidence intervals (CIs) of correlation at each spot compute spots where CI does not overlap zero (i.e. putative regions with non-zero correlation) 3. For each cluster, compute a WR P-value 4. Remove all clusters with WR P-value < reject_thresh for BR-test and for remaining clusters, compute BR P-value testing for differential correlation between the two clusters
- Parameters
- gene_1: string
The first gene of the pair to analyze
- gene_2: string
The second gene of the pair to analyze
- adataAnnData
spatial gene expression dataset with spatial coordinates stored in adata.obs
- bandwidthint
the kernel bandwidth used by the test
- cond_keystring
the name of the column in adata.obs storing the cluster assignments
- row_keystring, optional (default: ‘row’)
the name of the column in adata.obs storing the row coordinates of each spot
- col_keystring, optional (default: ‘col’)
the name of the column in adata.obs storing the column coordinates of each spot
- reject_thresh: float (default: 0.05)
P-value threshold used to reject the null hypothesis for each region’s WR-test as well as region-pairwise BR-tests.
- dsize: int, optional (default: 12)
the size of the dots in the scatterplot
- max_permsint, optional (default: 500)
Maximum number of permutations to compute for the permutation test
- n_procsint, optional (default: 1)
number of processes to run in parallel
- verboseint, optional (default: 1)
the verbosity. Higher verbosity will lead to more debugging information printed to standard output
- contrib_threshint, optional (default: 10)
threshold for the total weight of all samples contributing to the correlation estimate at each spot. Spots with total weight less than this value will be filtered prior to running the test
- fig_path: string, optional (default: None)
Path to write figure image.
- fig_format: string, {‘pdf’, ‘png’} (default: ‘pdf’)
Format of the output figure file.
- dpi: int (default: 150)
Resolution of output image.
- Returns
- None
It outputs the following multi-panel figure:
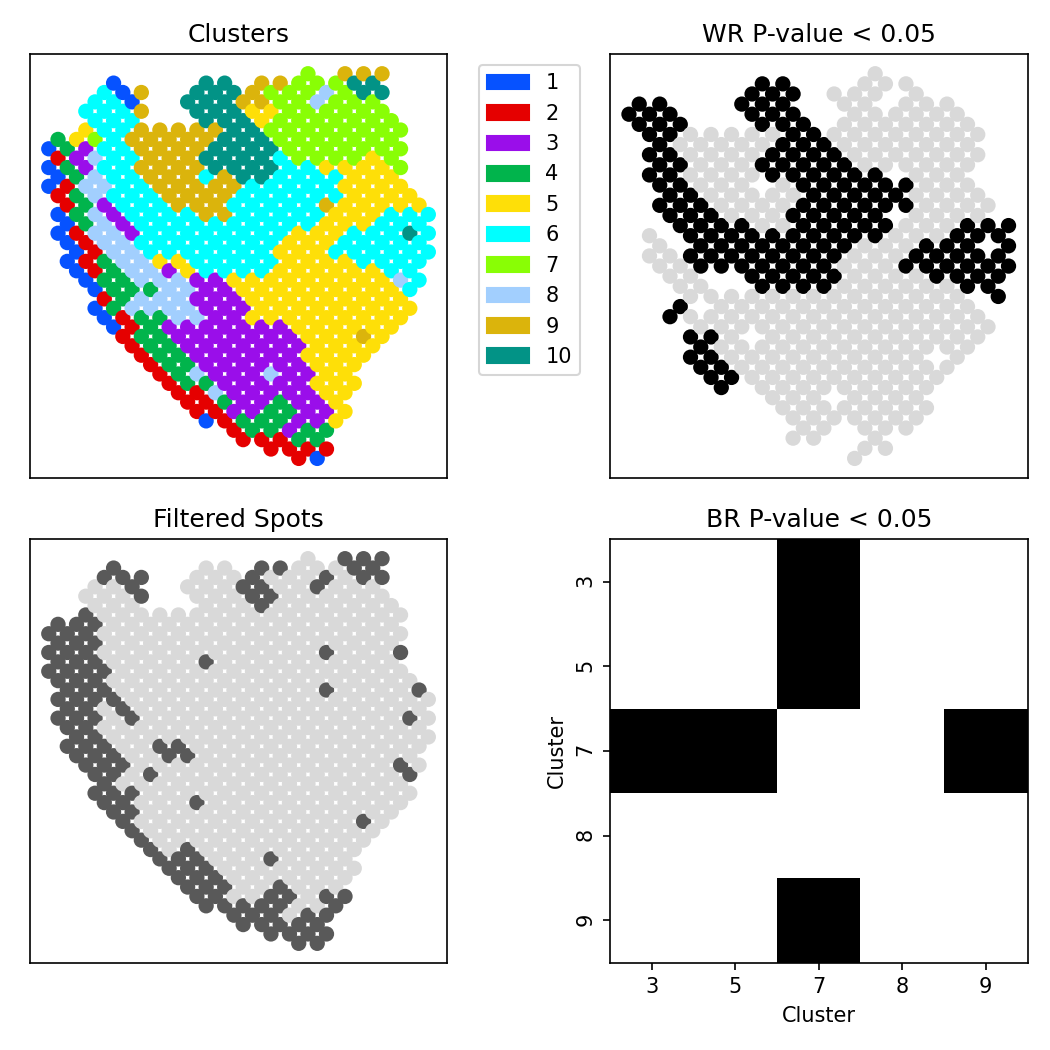
The following wrapper function implements a full analysis pipeline for investigating spatially varying correlation between a set of genes.
- spatialcorr.analysis_pipeline_set(genes, adata, cond_key, row_key='row', col_key='col', reject_thresh=0.05, dsize=12, bandwidth=5, max_perms=500, n_procs=5, run_br=False, spot_to_neighbors=None, spot_to_neighbors_clust=None, contrib_thresh=10, verbose=1, fig_path=None, fig_format='pdf', dpi=150)
Run a SpatialCorr analysis pipeline on a set of genes.
This function will run the following analyses: 1. For each cluster, compute a WR P-value 2. Remove all clusters with WR P-value < reject_thresh for BR-test and for remaining clusters, compute BR P-value testing for differential correlation between the two clusters
- Parameters
- genes: List
List of genes in the gene set
- adataAnnData
spatial gene expression dataset with spatial coordinates stored in adata.obs
- bandwidthint
the kernel bandwidth used by the test
- cond_keystring
the name of the column in adata.obs storing the cluster assignments
- row_keystring, optional (default: ‘row’)
the name of the column in adata.obs storing the row coordinates of each spot
- col_keystring, optional (default: ‘col’)
the name of the column in adata.obs storing the column coordinates of each spot
- reject_thresh: float (default: 0.05)
P-value threshold used to reject the null hypothesis for each region’s WR-test as well as region-pairwise BR-tests.
- dsize: int, optional (default: 12)
the size of the dots in the scatterplot
- max_permsint, optional (default: 500)
Maximum number of permutations to compute for the permutation test
- n_procsint, optional (default: 1)
number of processes to run in parallel
- verboseint, optional (default: 1)
the verbosity. Higher verbosity will lead to more debugging information printed to standard output
- contrib_threshint, optional (default: 10)
threshold for the total weight of all samples contributing to the correlation estimate at each spot. Spots with total weight less than this value will be filtered prior to running the test
- fig_path: string, optional (default: None)
Path to write figure image.
- fig_format: string, {‘pdf’, ‘png’} (default: ‘pdf’)
Format of the output figure file.
- dpi: int (default: 150)
Resolution of output image.
- Returns
- None
It outputs the following multi-panel figure:
Statistical
- spatialcorr.run_test(adata, test_genes, bandwidth, run_br=False, cond_key=None, contrib_thresh=10, row_key='row', col_key='col', precomputed_kernel=None, verbose=1, n_procs=1, compute_spotwise_pvals=True, standardize_var=False, max_perms=10000, mc_pvals=True, spot_to_neighbors=None, alpha=0.05, compute_gene_pair_pvals=False, gene_pair_perms=100)
Run the SpatialCorr statistical test to identify spatially varying correlation for a given set of genes.
- Parameters
- adataAnnData
Spatial gene expression dataset with spatial coordinates stored in adata.obs.
- test_geneslist
List of gene names for which to test for spatially varying correlation.
- bandwidthint
The kernel bandwidth used by the test.
- run_br: boolean, default: False
If False, run the WHR-test. If True, run the BHR-test
- cond_keystring
The name of the column in adata.obs storing the cluster assignments.
- contrib_threshinteger, optional (default: 10)
Threshold for the total weight of all samples contributing to the correlation estimate at each spot. Spots with total weight less than this value will be filtered prior to running the test.
- row_keystring, optional (default: ‘row’)
The name of the column in adata.obs storing the row coordinates of each spot.
- col_keystring, optional (default: ‘col’)
The name of the column in adata.obs storing the column coordinates of each spot.
- verboseint, optional (default: 1)
The verbosity. Higher verbosity will lead to more debugging information printed to standard output.
- n_procsint, optional (default: 1)
Number of processes to run in parallel.
- max_permsint, optional (default: 10000)
Maximum number of permutations to compute for the permutation test.,
- mc_pvalsboolean, optional (default: True)
If True, use Sequential Monte Carlo P-values. If False, use max_perms number of permutations.
- Returns
- p_val: float
A permutation p-value for the log-likelihood ratio test.
- additional: dict
A dictionary of additional information computed during the test. If run_br is False, the region-specific p-values are located in additional[‘region_to_p_val’]. The FDR-adjusted p-values (via Benjamini Hochberg) are stored in additional[‘region_to_adj_p_val’].
- spatialcorr.run_test_between_region_pairs(adata, test_genes, bandwidth, cond_key, contrib_thresh=10, row_key='row', col_key='col', verbose=1, n_procs=1, standardize_var=False, max_perms=10000, mc_pvals=True, spot_to_neighbors=None, run_regions=None, clust_size_lim=0)
Run the SpatialCorr BR-test between very pair of regions on the slide.
- Parameters
- adataAnnData
Spatial gene expression dataset with spatial coordinates stored in adata.obs.
- test_geneslist
List of gene names for which to test for spatially varying correlation.
- bandwidthint
The kernel bandwidth used by the test.
- cond_keystring
The name of the column in adata.obs storing the cluster assignments.
- contrib_threshinteger, optional (default: 10)
Threshold for the total weight of all samples contributing to the correlation estimate at each spot. Spots with total weight less than this value will be filtered prior to running the test.
- row_keystring, optional (default: ‘row’)
The name of the column in adata.obs storing the row coordinates of each spot.
- col_keystring, optional (default: ‘col’)
The name of the column in adata.obs storing the column coordinates of each spot.
- verboseint, optional (default: 1)
The verbosity. Higher verbosity will lead to more debugging information printed to standard output.
- n_procsint, optional (default: 1)
number of processes to run in parallel
- standardize_var: Boolean (default: False)
If true, standardize the variance between regions (in additon to the means) before running the BR-test.
- max_permsint, optional (default: 10000)
Maximum number of permutations to compute for the permutation test.
- mc_pvalsboolean, optional (default: True)
If True, use Sequential Monte Carlo P-values. If False, use max_perms number of permutations.
- Returns
- reg_to_reg_to_pval: dictionary
A dictionary of dictionaries mapping each region-pair to its pairwise BR-test p-value.
- spatialcorr.est_corr_cis(gene_1, gene_2, adata, bandwidth, cond_key, precomputed_kernel=None, confidence_interval=0.95, spot_to_neighs=None, neigh_thresh=10, n_boots=100, row_key='row', col_key='col')
Compute approximate confidence intervals around the kernel estimates of spot wise correlation.
- Parameters
- gene_1: string
Name or id of first gene.
- gene_2: string
Name or id of second gene.
- adataAnnData
Spatial gene expression dataset with spatial coordinates stored in adata.obs.
- bandwidthint
The kernel bandwidth used for the kernel estimates of correlation at each spot.
- cond_keystring
The name of the column in adata.obs storing the cluster assignments.
- precomputed_kernelArray (default: None)
An NxN array storing a precomputed kernel matrix, where N is the number of spots. If None a kernel will be computed using the bandwidth parameter and conditioning on cond_key.
- confidence_intervalfloat (default: 0.95)
Confidence interval to compute for each spot.
- spot_to_neighs: dict, optional (default: None)
A dictionary mapping each spot to a list of neighboring spots. If not provided, this will be computed automatically.
- neigh_threshinteger, optional (default: 10)
Threshold for the total number of neighbors contributing to the correlation estimate at each spot. Spots with total neighbors less than this value will be filtered prior to running the test.
- row_keystring, optional (default: ‘row’)
The name of the column in adata.obs storing the row coordinates of each spot.
- col_keystring, optional (default: ‘col’)
The name of the column in adata.obs storing the column coordinates of each spot.
- Returns
- cis: list
A list of pairs, one for each kept spot after filtering, storing the confidence interval boundaries.
- keep_inds: list
A list of kept indices after applying the effective-neighbors threshold. The confidence intervals in cis correspond to these spots.
Plotting
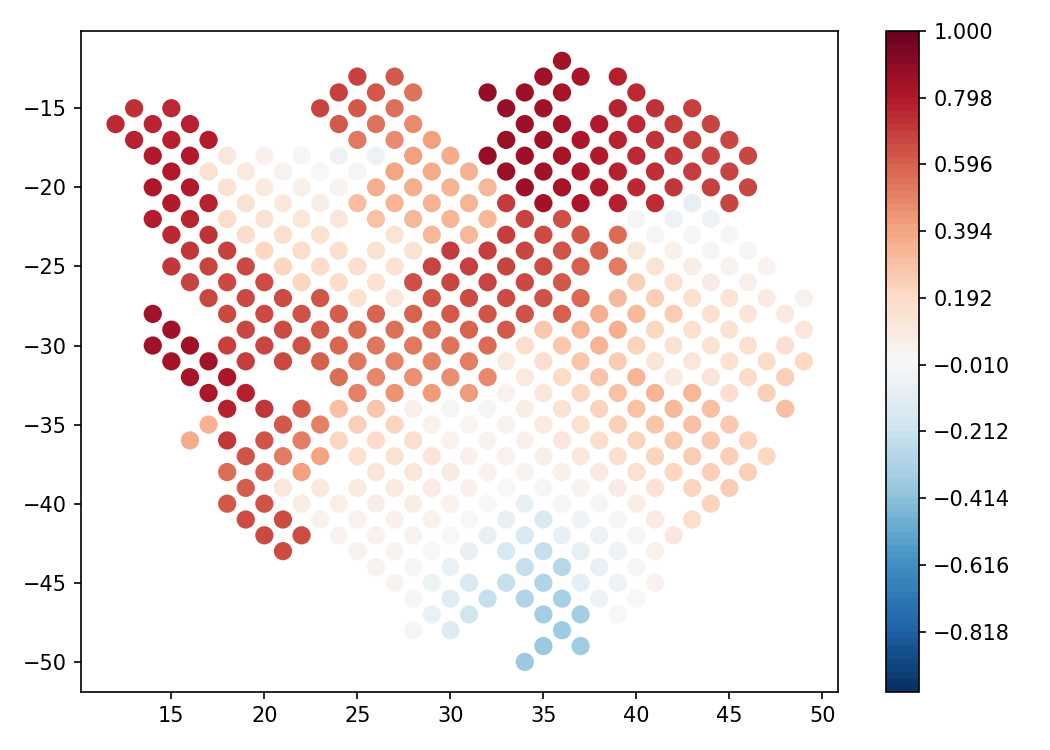
- spatialcorr.plot.plot_correlation(adata, gene_1, gene_2, bandwidth=5, contrib_thresh=10, kernel_matrix=None, row_key='row', col_key='col', condition=None, cmap='RdBu_r', colorbar=True, ticks=True, ax=None, figure=None, dsize=10, estimate='local', title=None, spot_borders=False, border_color='black', border_size=0.3, fig_path=None, fig_format='pdf', fig_dpi=150)
Plot the slide with each spot colored by the correlation between two genes.
- Parameters
- adataAnnData
Spatial gene expression dataset with spatial coordinates stored in adata.obs.
- gene_1string
The name or ID of the first gene.
- gene_2string
The name or ID of the second gene.
- estimatestring, optional (default
One of {‘local’, ‘regional’}. The estimation method used to estimate the correlation at each spot. If ‘local’, use Gaussian kernel estimation. If ‘regional’, use all of the spots in the given spot’s histological region.
- kernel_matrixndarray, optional (default
NxN matrix representing the spatial kernel (i.e., pairwise weights between spatial locations). If not provided, one will be computed using the bandwidth and contrib_thresh arguments.
- bandwidthint, optional (default
The kernel bandwidth used by the test. Only applied if estimate is set to ‘local’. Only applied if kernel_matrix is not provided.
- contrib_threshinteger, optional (default: 10)
Threshold for the total weight of all samples contributing to the correlation estimate at each spot. Spots with total weight less than this value will be filtered. Only applied if estimate is set to ‘local’. Only applied if kernel_matrix is not provided.
- row_keystring, optional (default
The name of the column in adata.obs storing the row coordinates of each spot.
- col_keystring, optional (default
The name of the column in adata.obs storing the column coordinates of each spot.
- conditionstring, optional (default
The name of the column in adata.obs storing the cluster assignments.
- cmapstring (default
The colormap to use to color the spots.
- colorbarboolean (default
If True, plot the colorbar next to the figure.
- ticksboolean (default: True)
If True, show tickmarks along x and y axes indicated spatial coordinates.
- dsizeint (default
The size of the dots in the scatterplot.
- titlestring (default
The plot title.
- spot_bordersboolean (default
If True, draw a border line around each spot.
- border_colorstring (default
The color of the border line around each spot. Only used if spot_borders is True.
- border_sizefloat (default
The thickness of the border line around each spot. Only used if spot_borders is True.
- ticksboolean (default: True)
If True, show tickmarks along x and y axes indicated spatial coordinates.
- fig_pathstring, optional (default
Path to save figure as file.
- fig_formatstring, optional (default
File format to save figure.
- fig_dpistring, optional (default
Resolution of figure.
- Returns
- None
- spatialcorr.plot.plot_ci_overlap(adata, gene_1, gene_2, cond_key='cluster', kernel_matrix=None, bandwidth=5, row_key='row', col_key='col', title=None, ax=None, figure=None, ticks=False, dsize=12, colorticks=None, neigh_thresh=10, fig_path=None, fig_format='pdf', fig_dpi=150)
Plot the spots and color each spot whether the 95% confidence interval of the Guassian estimate of correlation overlaps zero (computed using the bootstrap with 100 hundred sampels). A spot is colored red if the CI lies entirely above zero, blue if the CI lies entirely below zero, and grey if the CI overlaps zero.
- Parameters
- adataAnnData
Spatial gene expression dataset with spatial coordinates stored in adata.obs.
- gene_1string
The name or ID of the first gene.
- gene_2string
The name or ID of the second gene.
- kernel_matrixndarray, optional (default
NxN matrix representing the spatial kernel (i.e., pairwise weights between spatial locations)
- bandwidthint, optional (default
The kernel bandwidth used by the test. Only applied if estimate is set to ‘local’. Only applied if kernel_matrix is set to None.
- neigh_threshinteger, optional (default: 10)
Threshold for the total number of neighbors contributing to the correlation estimate at each spot. Spots with total neighbors less than this value will be filtered prior to running the test.
- row_keystring, optional (default: ‘row’)
The name of the column in adata.obs storing the row coordinates of each spot.
- col_keystring, optional (default: ‘col’)
The name of the column in adata.obs storing the column coordinates of each spot.
- cond_keystring (default
The name of the column in adata.obs storing the cluster assignments.
- ticksboolean (default: True)
If True, show tickmarks along x and y axes indicated spatial coordinates.
- dsizeint (default
The size of the dots in the scatterplot.
- titlestring (default
The plot title.
- fig_pathstring, optional (default
Path to save figure as file.
- fig_formatstring, optional (default
File format to save figure.
- fig_dpistring, optional (default
Resolution of figure.
- Returns
- None

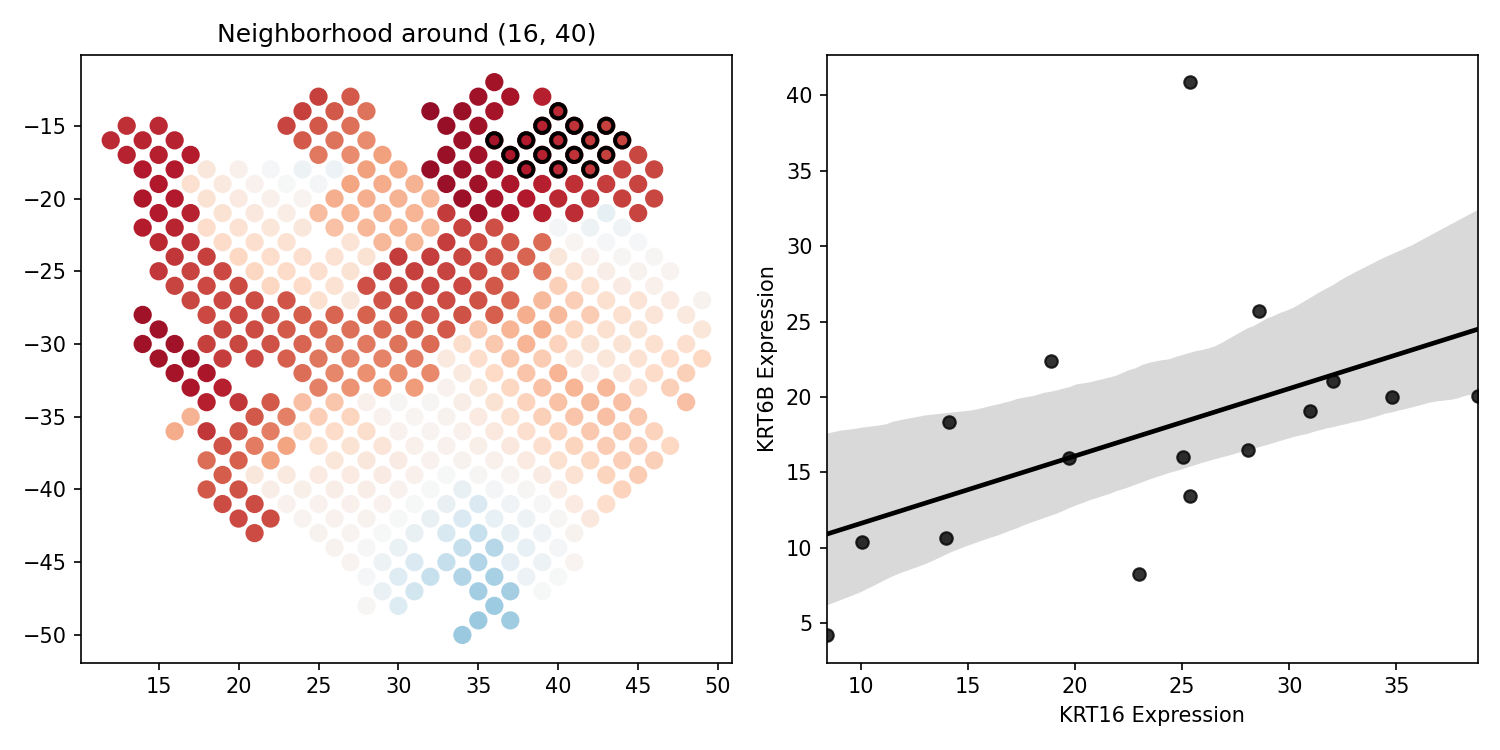
- spatialcorr.plot.plot_local_scatter(adata, gene_1, gene_2, row, col, plot_vals, color_spots=None, condition=None, vmin=None, vmax=None, row_key='row', col_key='col', cmap='RdBu_r', neighb_color='black', plot_neigh=True, width=10, height=5, dsize=15, line_color='black', scatter_xlim=None, scatter_ylim=None, scatter_xlabel=None, scatter_ylabel=None, scatter_title=None, fig_path=None, fig_format='pdf', fig_dpi=150)
Plot the spots colored according to some specified values and, for a given spot, plot the expression scatterplot between two genes in the neighborhood of the given spot. Also draws an ordinary least squares regression line atop this scatterplot.
- Parameters
- adataAnnData
Spatial gene expression dataset with spatial coordinates stored in adata.obs.
- gene_1string
The name or ID of the first gene.
- gene_2string
The name or ID of the second gene.
- rowint
The row-coordinate to center the neighborhood.
- colint
The column-coordinate to center the neighborhood.
- plot_valsndarray
An N-length array of values used to color each spot where N is the total number of spots (i.e., length of adata).
- row_keystring, optional (default: ‘row’)
The name of the column in adata.obs storing the row coordinates of each spot.
- col_keystring, optional (default: ‘col’)
The name of the column in adata.obs storing the column coordinates of each spot.
- conditionstring, optional (default
The name of the column in adata.obs storing the cluster assignments.
- vminfloat, optional (default
Minimum value used to color the spots (i.e., the lower limit of the colors).
- vmaxfloat, optional (default
Maximum value used to color the spots (i.e., the lower limit of the colors).
- cmapstring, optional (default
The colormap to use to color the spots.
- plot_neighboolean, optional (default
If True, outline the spots that are included in the neighborhood.
- neighb_colorstring (default
Color used to color the neighborhood of spots on the slide. Only applied if plot_neigh is True.
- widthfloat, optional (default
Figure width.
- heightfloat, optional (default
Figure height.
- dsizefloat, optional (default
Size of each spot.
- line_colorstring, optional (default
Color used for the regression line.
- scatter_xlimfloat, optional (default
X-axis limits of regression plot.
- scatter_ylimfloat, optional (default
Y-axis limits of regression plot.
- scatter_xlabelstring, optional (default
X-axis label for regression plot.
- scatter_ylabelstring, optional (default
Y-axis label for regression plot.
- scatter_titlestring, optional (default
Title for regression plot.
- fig_pathstring, optional (default
Path to save figure as file.
- fig_formatstring, optional (default
File format to save figure.
- fig_dpistring, optional (default
Resolution of figure.
- Returns
- None
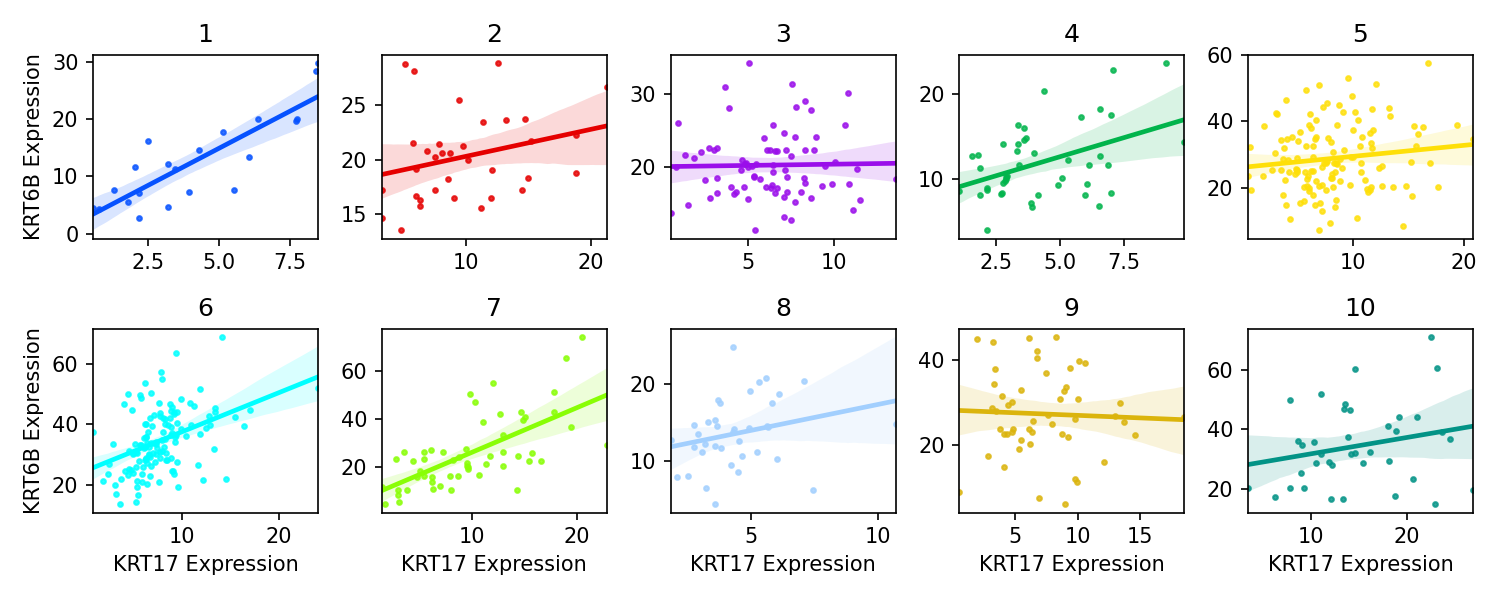
- spatialcorr.plot.region_scatterplots(gene_1, gene_2, adata, cond_key, row_key='row', col_key='col', xlim=None, ylim=None, fig_path=None, fig_format='png', fig_dpi=150)
For a given pair of genes, plot the scatterplot of expression values of these two genes for each histological region.
- Parameters
- adataAnnData
Spatial gene expression dataset with spatial coordinates stored in adata.obs.
- gene_1string
The name or ID of the first gene.
- gene_2string
The name or ID of the second gene.
- cond_keystring, optional (default
The name of the column in adata.obs storing the cluster assignments.
- row_keystring, optional (default
The name of the column in adata.obs storing the row coordinates of each spot.
- col_keystring, optional (default
The name of the column in adata.obs storing the column coordinates of each spot.
- cond_keystring, optional (default
The name of the column in adata.obs storing the cluster assignments.
- xlimtuple, optional (default: None)
The x-axis limits for each scatterplot.
- ylimtuple, optional (default: None)
The y-axis limits for each scatterplot.
- fig_pathstring, optional (default
The path to the file to which to save the figure.
- fig_formatstring, optional (default
File format to save figure.
- fig_dpistring, optional (default
Resolution of figure.
- Returns
- ——
- None
- spatialcorr.plot.mult_genes_plot_correlation(adata, plot_genes, cond_key, estimate='local', bandwidth=5, kernel_matrix=None, contrib_thresh=10, row_key='row', col_key='col', dsize=7, fig_path=None, fig_format='png', fig_dpi=150)
Create a grid of plots for displaying the correlations between pairs of genes across all spots. That is, each spot in the grid displays the spot-specific correlation between a given pair of genes.
- Parameters
- adataAnnData
Spatial gene expression dataset with spatial coordinates stored in adata.obs.
- plot_geneslist
List of gene names or IDs. This function will consider the spot-specific correlation for every pair of genes in this list.
- estimatestring, optional (default
One of {‘local’, ‘regional’, ‘local_ci’}. The estimation method used to estimate the correlation at each spot. If ‘local’, use Gaussian kernel estimation. If ‘regional’, use all of the spots in the given spot’s histological region. If ‘local_ci’ is used, then each spot will be colored based on whether the 95% confidence interval of the Gaussian kernel estimate overlaps zero.
- kernel_matrixndarray, optional (default
NxN matrix representing the spatial kernel (i.e., pairwise weights between spatial locations). If not provided, one will be computed using the bandwidth and contrib_thresh arguments. Only applied if estimate is set to ‘local’ or ‘local_ci’.
- bandwidthint, optional (default
The kernel bandwidth used by the test. Only applied if estimate is set to ‘local’. Only applied if kernel_matrix is not provided and estimate is set to ‘local’ or ‘local_ci’.
- contrib_threshinteger, optional (default: 10)
Threshold for the total weight of all samples contributing to the correlation estimate at each spot. Spots with total weight less than this value will be filtered. Only applied if estimate is set to ‘local’. Only applied if kernel_matrix is not provided and estimate is set to ‘local’ or ‘local_ci’.
- row_keystring, optional (default
The name of the column in adata.obs storing the row coordinates of each spot.
- col_keystring, optional (default
The name of the column in adata.obs storing the column coordinates of each spot.
- dsizeint, optional (default
The size of the dots in each plot.
- fig_pathstring, optional (default
Path to save figure as file.
- fig_formatstring, optional (default
File format to save figure.
- fig_dpistring, optional (default
Resolution of figure.
- Returns
- None

- spatialcorr.plot.cluster_pairwise_correlations(adata, plot_genes, cond_key, bandwidth=5, row_key='row', col_key='col', color_thresh=19, title=None, remove_y_ticks=False, fig_path=None, fig_size=(6, 4), fig_format='png', fig_dpi=150)
Cluster the patterns of correlations across all spots between pairs of genes. Plot a dendrogram of the clustering. Each leaf in the dendrogram represents a single pair of genes. Two pairs will cluster together if their pattern of correlation, across all of the spots, are similar.
- Parameters
- adataAnnData
Spatial gene expression dataset with spatial coordinates stored in adata.obs.
- plot_geneslist
List of gene names or IDs. This function will consider the spot-specific correlation for every pair of genes in this list.
- color_threshfloat, optional, default: 19
The value along the y-axis of the dendrogram to use as a threshold for coloring the subclusters. The sub-dendrograms below this threshold will be given unique colors. The part of the dendrogram lying above this threshold will be colored grey.
- row_keystring, optional (default
The name of the column in adata.obs storing the row coordinates of each spot.
- col_keystring, optional (default
The name of the column in adata.obs storing the column coordinates of each spot.
- cond_keystring, optional (default
The name of the column in adata.obs storing the cluster assignments.
- fig_pathstring, optional (default
The path to the file to which to save the figure.
- fig_sizetuple, optional (default
Figure height and width.
- fig_formatstring, optional (default
File format to save figure.
- fig_dpistring, optional (default
Resolution of figure.
- Returns
- ——
- None

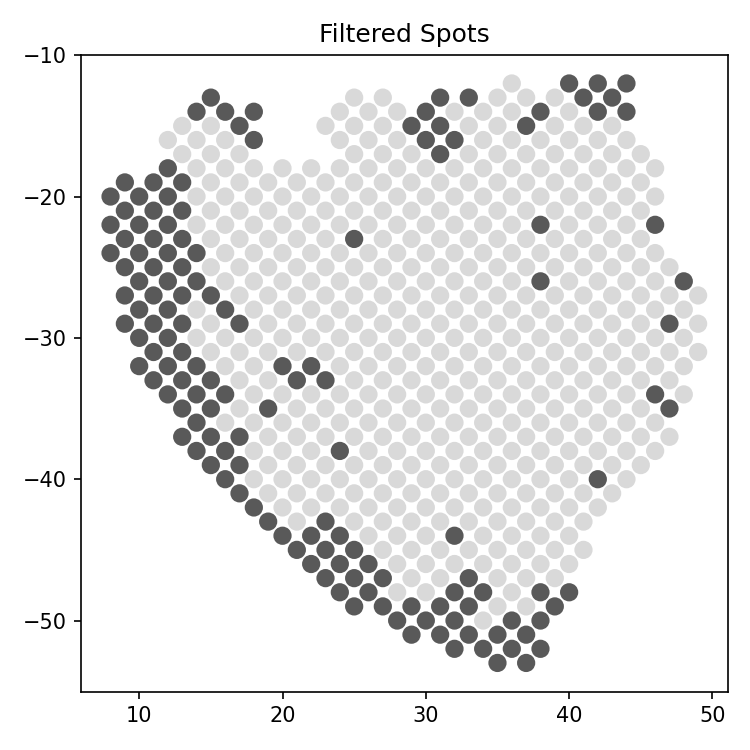
- spatialcorr.plot.plot_filtered_spots(adata, kernel_matrix, contrib_thresh, row_key='row', col_key='col', ax=None, figure=None, dsize=37, ticks=True, fig_path=None, fig_format='pdf', fig_dpi=150)
Plot the slide with spots colored according to whether they would be filtered according to the effective-neighbors filter. The effective-neighbors filter removes spots for which the sum of the weights applied to neighboring spots, according to the Gaussian kernel, do not exceed a specified threshold.
- Parameters
- adataAnnData
Spatial gene expression dataset with spatial coordinates stored in adata.obs.
- kernel_matrixndarray
NxN matrix representing the spatial kernel (i.e., pairwise weights between spatial locations)
- contrib_threshinteger, optional (default: 10)
Threshold for the total weight of all samples contributing to the correlation estimate at each spot. Spots with total weight less than this value will be filtered.
- row_keystring, optional (default: ‘row’)
The name of the column in adata.obs storing the row coordinates of each spot.
- col_keystring, optional (default: ‘col’)
The name of the column in adata.obs storing the column coordinates of each spot.
- axAxis (default: None)
Draw plot on provided Matplotlib Axis.
- figureFigure (default
Draw plot on provided Matplotlib Figure.
- dsizeint (default
The size of the dots in the scatterplot.
- ticksboolean (default: True)
If True, show tickmarks along x and y axes indicated spatial coordinates.
- fig_pathstring, optional (default
Path to save figure as file.
- fig_formatstring, optional (default
File format to save figure.
- fig_dpistring, optional (default
Resolution of figure.
- Returns
- None
- spatialcorr.plot.plot_slide(df, values, cmap='viridis', colorbar=False, vmin=None, vmax=None, title=None, ax=None, figure=None, ticks=True, dsize=37, colorticks=None, row_key='row', col_key='col', cat_palette=None, spot_borders=False, border_color='black', border_size=0.3)
Plot the slide with each spot colored according to a specified set of values.
- Parameters
- dfDataFrame
A pandas DataFrame storing the coordinates for each spot.
- valuesndarray
An N-length array of values, corresponding to the N spots, that should be used to color each spot.
- row_keystring, optional (default: ‘row’)
The name of the column in adata.obs storing the row coordinates of each spot.
- col_keystring, optional (default: ‘col’)
The name of the column in adata.obs storing the column coordinates of each spot.
- cmapstring, optional (default
The colormap to use to color the spots. If the values array of values are discrete categories, then one can supply the argument categorical.
- cat_palette, optional (default
A palette (list) of colors to use for coloring categorical values. Only applied if cmap is set to ‘categorical’.
- colorbarboolean, optional (default
If True, plot the colorbar next to the figure.
- ticksboolean (default: True)
If True, show tickmarks along x and y axes indicated spatial coordinates.
- dsizeint (default
The size of the dots in the scatterplot.
- titlestring (default
The plot title.
- spot_bordersboolean (default
If True, draw a border line around each spot.
- border_colorstring (default
The color of the border line around each spot. Only used if spot_borders is True.
- border_sizefloat (default
The thickness of the border line around each spot. Only used if spot_borders is True.
- Returns
- None
Helper functions
- spatialcorr.compute_local_correlation(adata, gene_1, gene_2, kernel_matrix=None, row_key='row', col_key='col', condition=None, bandwidth=5, contrib_thresh=10)
Calculate the correlation at each spot using Guassian kernel estimation for a pair of genes.
- Parameters
- adataAnnData
Spatial gene expression dataset with spatial coordinates stored in adata.obs.
- gene_1string
The name or ID of the first gene.
- gene_2string
The name or ID of the second gene.
- kernel_matrixndarray
An NxN matrix, where N is the number of spots, storing the value of the Guassian kernel for each pair of spots.
- row_keystring, optional (default
The name of the column in adata.obs storing the row coordinates of each spot.
- col_keystring, optional (default
The name of the column in adata.obs storing the column coordinates of each spot.
- conditionstring (default
The name of the column in adata.obs storing the histological region of each spot that should be conditioned on by the Gaussian kernel.
- bandwidthint, optional (int
The kernel bandwidth used by the test.
- contrib_threshinteger, optional (default
Threshold for the total weight of all samples contributing to the correlation estimate at each spot. Spots with total weight less than this value will be filtered prior to running the test (i.e., the effective-neighbors filter).
- Returns
- corrs: ndarray
An F-length array of correlation values storing the F spots kept after applying the effective-neighbors kernel.
- keep_indsndarray
An F-lenght array of the indices of the original adata object that were kept after applying the effective-neighbors kernel. The values in corrs correspond to these spots.
- spatialcorr.most_significant_pairs(additional)
Extract the most statistically significantly varying gene pairs from the results SpatialCorr run on a gene set.
- Parameters
- additional: dictionary
A dictionary storing the “additional” results from a SpatialCorr run on a gene set. Note, this dictionary must store the gene-pair test results (i.e., the results of the test run on each individual pair of genes within the gene set), which can be obtained by running spatialcorr.run_test, with the compute_gene_pair_pvals argument set to True.
- Returns
- df_top_pairs: DataFrame
A pandas DataFrame storing the gene-pairs ranked by their p-value under the SpatialCorr test.
- spatialcorr.compute_kernel_matrix(df, bandwidth, region_key='cluster', condition_on_region=False, y_col='row', x_col='col', dist_matrix=None)
Compute the Gaussian kernel matrix between spots.
- Parameters
- df: DataFrame
A pandas DataFrame storing the coordinates of each spot.
- bandwidth: float
The Gaussian kernel bandwidth parameter. Higher values increase the size of the kernel.
- region_key: string, optional (default: ‘cluster’)
The column in df storing the region annotations for ensuring that the kernel conditions on regions/clusters. Only used if condition_on_region is True.
- condition_on_region: boolean, optional (default: False)
If True, compute the kernel conditioned on regions stored in region_key.
- y_col: string, optional (default: ‘row’)
The column in df storing the y-coordinates for each spot.
- x_col: string, optional (default: ‘col’)
The column in `df’ storing the x-coordinates for each spot.
- dist_matrix: ndarray, optional (default: None)
An NxN matrix storing the pairwise distances between spots to be used as input to the kernel. If None, Euclidean distances will be computed automatically.
- Returns
- kernel_matrix: ndarray
NxN array storing the pairwise weights between spots as computed by the Gaussian kernel.
- spatialcorr.covariance_kernel_estimation(kernel_matrix, X)
Compute the kernel estimate of the covariance matrix at each spatial location.
- Parameters
- kernel_matrix: ndarray
NxN matrix representing the spatial kernel (i.e., pairwise weights between spatial locations)
- X: ndarray
GxN expression matrix where G is number of genes and N is number of spots
- Returns
- all_covs: ndarray
NxGxG array storing the GxG covariance matrices at the N spots.
Datasets
- spatialcorr.load_dataset(dataset_id)
Load a prepackaged spatial gene expression dataset.
- Parameters
- dataset_idstring, Options: {‘GSM4284326_P10_ST_rep2’}
The ID of the dataset to load.
- Returns
- adataAnnData
The spatial gene expression dataset. The rows and column coordinates are stored in adata.obs[‘row’] and adata.obs[‘col’] respectively. The clusters are stored in adata.obs[‘cluster’]. The gene expression matrix adata.X is in units of Dino normalized expression values.